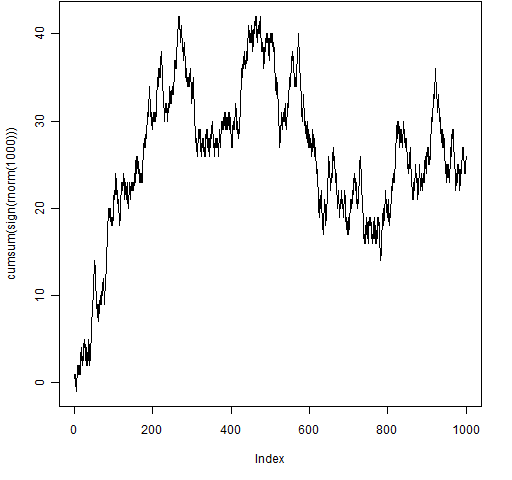
We’re really interested in markets, but we’ll start with a series of coin tosses. If the coin lands heads, then we go up one; if it lands tails, we go down one.
Figure 1: A coin toss path. Figure 1 is the result of one thousand coin flips. It is a random walk.
The R command that created Figure 1 was:
> plot(cumsum(sign(rnorm(1000))), type="l")
You can do it multiple times and see the variety of paths that is produced.
Random walks are on a tightrope between mean reversion and momentum.
Mean reversion
Suppose there were mean reversion in our coin toss. Then it would have a greater chance of tails if the process were above zero, and a greater chance of heads if the process were below zero.
With mean reversion it is as if there is gravity pulling the process back to zero — either down from high or up from low.
Momentum
Momentum is the opposite of mean reversion. With momentum the probability of a head is greater when there have already been more heads.
With momentum it is as if the coin likes doing what it has already done — the process is pushed away from zero.
Humans
We are really bad at distinguishing these three cases.
When people create a series of heads and tails “by hand”, they tend to create a mean-reverting series. We think long runs of heads or tails should be more rare than they are. When we create a series, we remember what has happened before. A random walk completely forgets the past.
The first 300 or so flips of Figure 1 are heavily dominated by heads. I find it hard to think of that as a random walk rather than an exhibition of momentum. Except I know how it was created and I have quite a lot of faith in the random generation in R. (That was the first path created by the way — there was no selection bias (actually, there might be — I might have redone it if I didn’t find the path “interesting”).)
Humans try to find meaning everywhere. Even when there is none.
Markets
The Efficient Market Hypothesis implies that markets are always on the tightrope of the random walk. The Efficient Market Hypothesis is wrong — it’s just a model and all models are wrong. In fact it is self-contradictory: it says that no one can make extra money because someone has already made extra money.
But it is a pretty good model for a lot of purposes. (See Perception switching.)
My suspicion is that the market’s tightrope act is one of leaning one way or the other (mean reversion or momentum) and righting itself before it falls completely off. It’s not going to be easy for us to know which state it is in. If we didn’t know the generating mechanism of Figure 1, would random walk be our best guess for the first part of the series?
Epilogue
A related blog post is: Are momentum strategies antisocial?
Photo by _gee_ via everystockphoto.com


Pingback: Tweets that mention The tightrope of the random walk between momentum and mean reversion #finance #markets #rstats -- Topsy.com
Pingback: Monday links: learn and attack Abnormal Returns
Pingback: The mean reversion of Groundhog Day | Portfolio Probe | Generate random portfolios. Fund management software by Burns Statistics
Pingback: Variability in maximum drawdown | Portfolio Probe | Generate random portfolios. Fund management software by Burns Statistics