
Beta is not volatility
March 26, 2012
The missing link between beta and volatility is correlation.
Previously
“4 and a half myths about beta in finance” attempted to dislodge several myths about beta, including that beta is about volatility.
“Low (and high) volatility strategy effects” showed a plot of beta versus volatility for stocks in the S&P 500 for estimates from 2006. This post looks at the same thing at the other end of the time frame used in that post.
Data
Betas and volatilities of almost all the stocks in the S&P 500 are estimated on the 250 trading days from 2011 March 01 to 2012 February 24. This should be thought of as a random — not data-snooped — window. Shorthand for this time period is the “final” window.
Pictures
Figure 1 shows beta versus volatility for the stocks. Like the similar graph in “Low (and high) volatility strategy effects” there is an outlier with high volatility but moderate beta. But it is a different stock.
Figure 1: The volatility versus beta estimates from the “final” window. 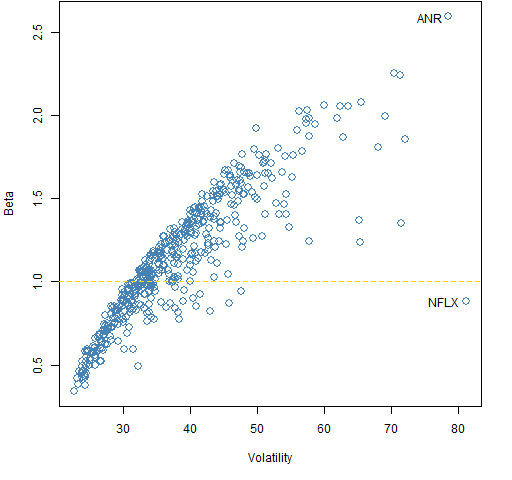
Figure 2: Returns for the S&P 500 and NFLX in the “final” window. 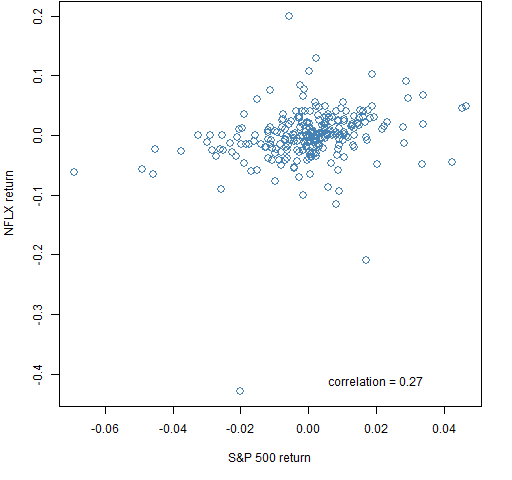 The beta of NFLX is small relative to its volatility because its correlation with the index is small. The smallest, actually. Figure 3 shows the distribution of the correlations.
Figure 3: Density of correlation of stocks to the S&P 500 during the “final” period — the vertical blue line is NFLX correlation. 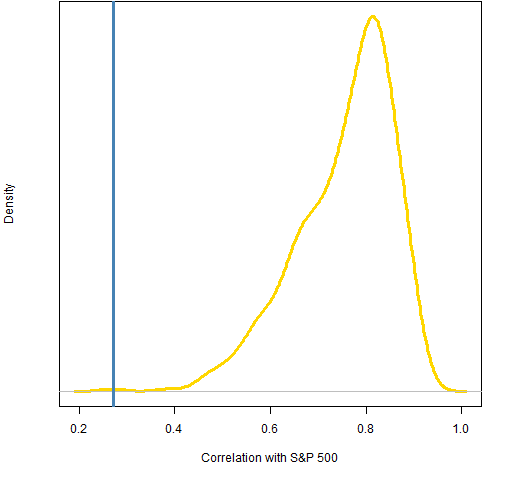 NFLX is clearly an outlier in terms of correlation with the index.
Figure 4 is an indication of the dynamics of the beta-volatility relationship.
Figure 4: Beta versus volatility from 2006 to the “final” period (blue points). 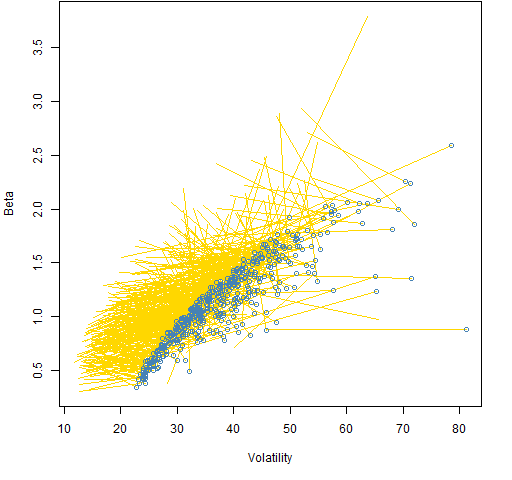 Figure 5 shows that the straight line in Figure 4 for NFLX was in actuality far from straight. But the beta estimate never went negative.
Figure 5: The beta-volatility dynamics of NFLX using a 250 trading day window. 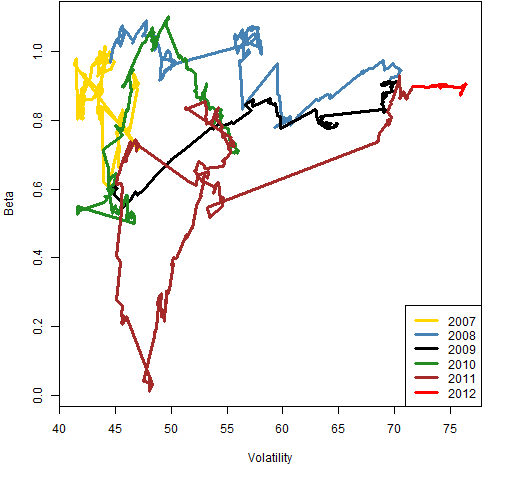 For the eagle-eyed and suspicious: The volatility estimate in Figure 5 is the usual unweighted standard deviation, but the volatilities in the other plots are time-weighted. Hence the numbers are not exactly the same for the same timepoints.
Summary
The correlation of a stock to the index is a determinant of the stock’s beta along with its volatility.
Beta is not constant.
Appendix R
segment plot
The code to produce Figure 4 is:
plot(sp5.volfin, sp5.betafin, xlab="Volatility",
        ylab="Beta", col="steelblue",
        xlim=range(sp5.vol06, sp5.volfin),
        ylim=range(sp5.beta06, sp5.betafin))
segments(sp5.volfin, sp5.betafin, sp5.vol06, sp5.beta06,
        col="gold")
points(sp5.volfin, sp5.betafin, col="steelblue")
beta-volatility dynamics
Two functions were written to create Figure 5 — one to do the computing, and one to do the actual plotting. They are pp.rollbetavol and pp.timeline. The second of these fails to say it in the function definition, but they are both in the public domain — you can do whatever you like with them.

[…] “Beta is not volatility” showed that beta and volatility are distinct concepts. […]
[…] Beta is not volatility […]