
Maximum weight of the low vol cohorts
March 29, 2012
Maximum weight was constrained to 4% at the start of 2007, how does that grow when unhindered?
Previously
“Low (and high) volatility strategy effects” created 6 sets of random portfolios as of 2007 and showed their performance up to about a month ago.
“Rebalancing the low vol cohorts” looked at how much turnover was required to move back to the constraints. This post looks at one of those constraints — how far away from the maximum weight of 4% have we drifted?
Pictures
Figure 1: Distribution of maximum weight for the “vanilla” portfolios. 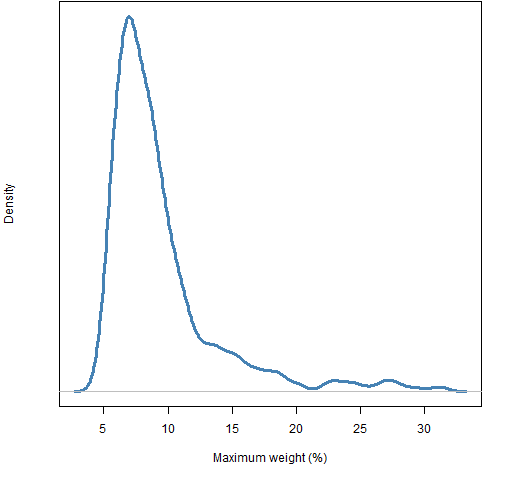 Quiz: Which 3 stocks from the S&P 500 are responsible for the values over 15% in Figure 1? (answer below)
Figure 2: Distribution of maximum weight for the “low variance” portfolios. 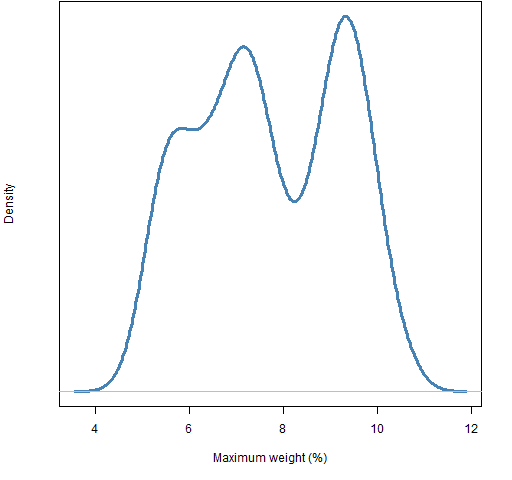 All these figures are based on only 1000 portfolios, so the specific features of the densities are somewhat noisy. However, looking at several bootstraps of the “low variance” maximum weights suggests that the density really is bimodal (and possibly trimodal). Why would that be?
Figure 3: Distribution of maximum weight for the “low volatility” portfolios. 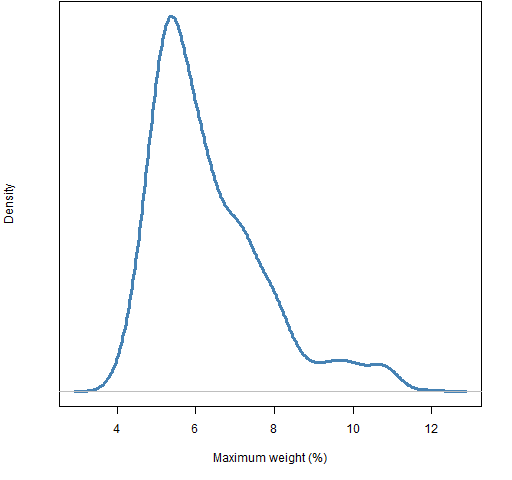
Figure 4: Distribution of maximum weight for the “low beta” portfolios. 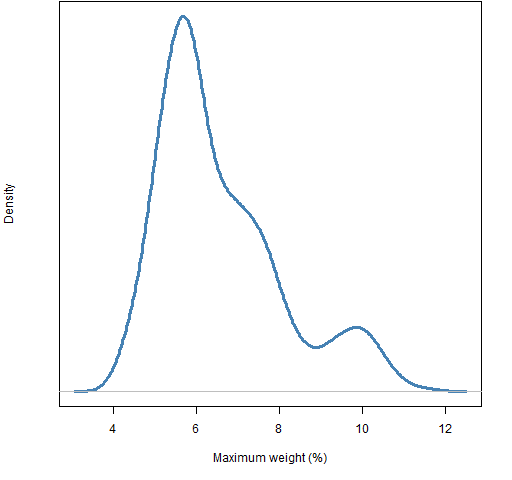
Figure 5: Distribution of maximum weight for the “high volatility” portfolios. 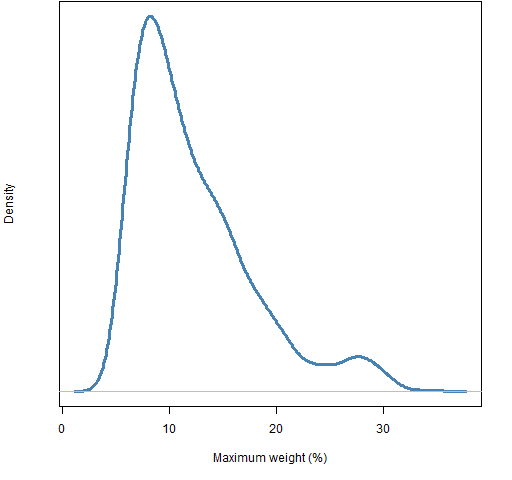
Figure 6: Distribution of maximum weight for the “high beta” portfolios. 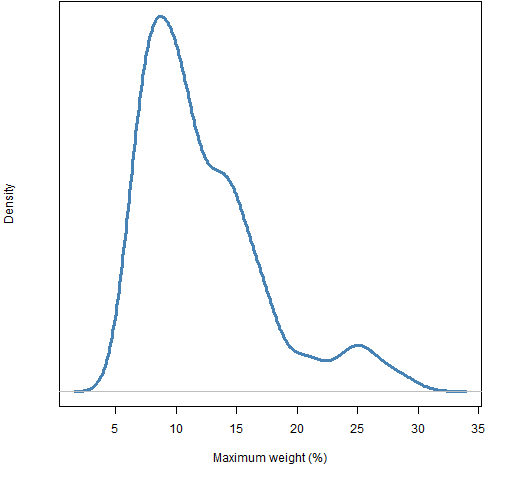
Quiz answer
Of the weights in Figure 1 over 15%: 9 were AAPL, 32 were CF and 55 were PCLN (and the top 37).

[…] “Maximum weight of the low vol cohorts” […]