
Investment performance: measurement versus calculation
November 4, 2013
I recently had a frustrating — for both parties — conversation involving performance measurement.
I said “measurement”. My dialogist heard “calculation” but wanted “measurement”. We went dizzy in the chase.
Calculation and Measurement
What’s the difference?
A calculation is what computers do.
A measurement is an assessment. It is a comparison with an ulterior motive.
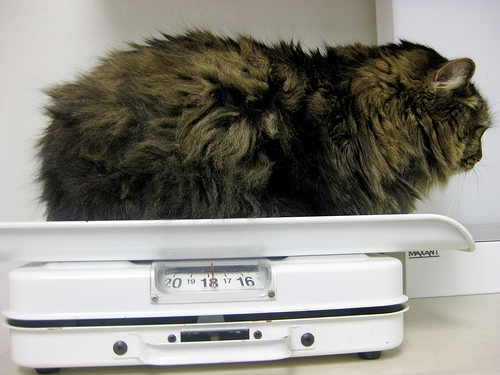
I’m not going to weigh myself unless there is the possibility of a change in behavior. If there is no value of my weight that is going to affect the way that I act, then weighing is pointless — the scale does the calculation but there is not actually a measurement.
If you can reasonably think of something as having no error, then that will be a calculation rather than a measurement. We can have 12 significant digits for the return of a fund in excess of a benchmark, but any assessment of investment benefit will struggle to have 2 significant digits.
Performance measurement
If performance measurement is done by an asset owner on an external fund, then the relevant action is adjusting the allocation to that fund (possibly to zero). If the measurement is done by the fund manager, then the possible action would be changing the investment process.
There are at least two desiderata for investment performance measurement:
- skill should be distinguished from luck
- investment decisions should be central
The only place that skill can be is in the investment decisions.
Let’s look at these on 4 schemes:
- a performance statistic relative to a benchmark
- a peer group
- a performance statistic relative to no trading
- random portfolios
Benchmark
Description: The simplest example is the return of the fund minus the return of the benchmark over multiple time periods. However, there are books filled with alternative performance statistics.
Decision-centricity: Pretty much none. The benchmark almost always encompasses the same selection of a universe of assets, but otherwise tends to be silent regarding investment decisions.
Luck-vs-skill: For practical purposes benchmarks provide essentially no information about skill — it takes decades for statistical significance to emerge.
Peer group
Description: Funds are clustered into groups by their similarity to each other.
Decision-centricity: In principle yes, in practice little useful information is produced.
Luck-vs-skill: On a scale of 1 to 10, this gets about a minus 3. It gives the illusion of informing us about skill while actually muddling luck and skill together. An implicit assumption of peer groups is that differences between funds in the group are due almost exclusively to skill and hardly at all to luck. That’s nonsense.
No trade
Description: A fund’s return over some time period is compared to the return if no trading had been done during the period. Other performance statistics can be used instead of the return.
Decision-centricity: 100%. This puts the trades done during the period clearly in the spotlight.
Luck-vs-skill: This provides very little information about skill, but probably much more than the previous two schemes. If the trading added 1% to the return, we don’t know if that is a lot or a little to add. Actually it is worse than that: it could actually be a bad result — it could be that almost all allowable trading would have added more than 1%.
Random portfolios
Description: There are multiple ways of using random portfolios for performance measurement, including providing the luck versus skill analysis for the no-trade scheme.
Decision-centricity: Yes. The constraints used when generating the random portfolios determine which investment decisions are examined.
Luck-vs-skill: Yes. Random portfolios show you the distribution of luck. You can then compare what actually happened to luck.
Epilogue
He’ll light your way but that is all
Steer your own ship back to shore
from “Lighthouse” by Kolwalczyk, Taylor, Dahlheimer and Gracey
Photo credit
kitty vet scale by melloveschallah via everystockphoto.

[…] On the difference between performance calculation and measurement. (Portfolio Probe) […]
Repeat this process until the stain is gone, but make sure too keep the
area wet until you are done with carpet cleaning.
Even if a few of these kinds of stains are partially
removed, oon a light coloured carpet they can still be quite detectable
and ugly. Whatever your reasons are, you may need a reliable carpet
cleaner.
Excellent blog here! Also your site loads up
very fast! What host are you using? Can I am getting your associate hyperlink in your host?
I desire my web site loaded up as fast as yours lol.