
Backtesting — almost wordless
November 5, 2010
On Tuesday I gave a talk at the Thalesians entitled “Effective backtesting”. You can get the annotated slides but below is an almost wordless introduction to backtesting.
Introduction
Figure 1.
 When you backtest, you attempt to see how an investment strategy would have worked during some historical period of time.
We can think of backtesting as attempting to build a bridge from the past to the future. Bridges don’t always work.
Figure 2: Tacoma Narrows Bridge on 1940 November 7 (6 minutes).
The Usual
The typical backtest will yield a plot of results like Figure 3.
Figure 3: Strategy performance relative to the benchmark.
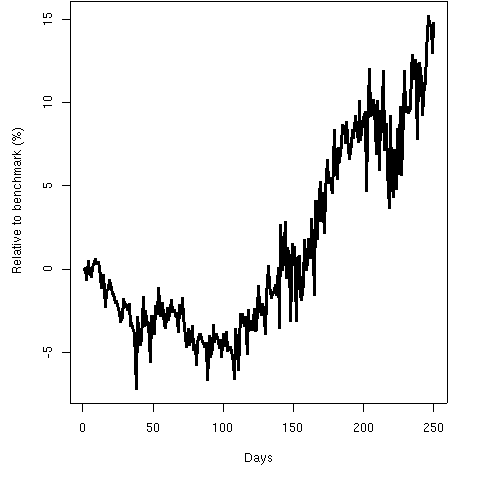 Does the strategy work for the full year?
Does the strategy work for the first quarter?
Doing better
We get deceived into thinking that Figure 3 answers those questions. It doesn’t.
The effect of the strategy is confounded with other things, most notably the performance of the portfolio that we start with.
Figure 4: Strategy performance and 95% confidence interval for zero effect.
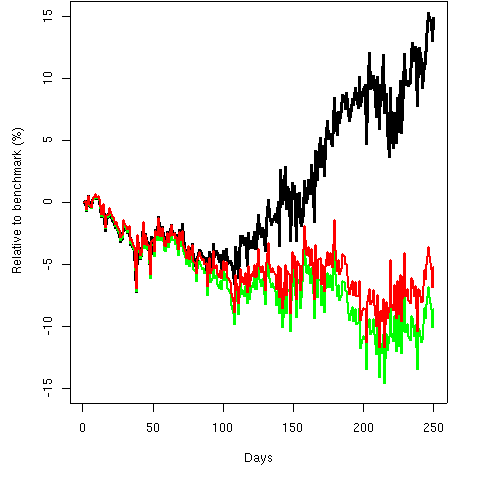
Figure 4 indicates the extent of paths that have no strategy at all, just random trading like the trading done with the strategy.
Figure 5: Strategy performance relative to mean random path.
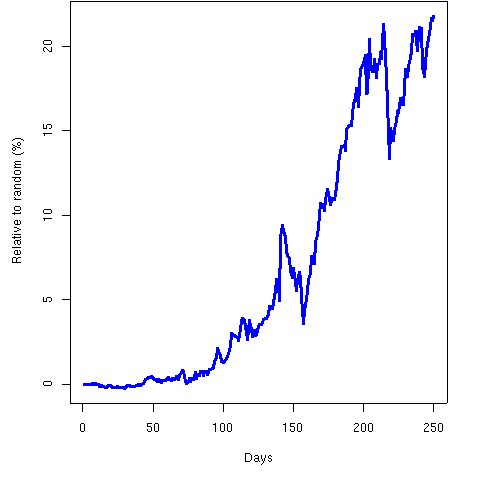 Figure 5 gives the performance of the strategy that we are really looking for. It has substantial differences from Figure 3 (the impostor).
Epilogue
Actually, we want to do this whole process several times with different starting portfolios because the effect of the strategy may well depend on the starting portfolio. This is discussed in the backtesting talk.
Photo in Figure 1 from istockphoto.com.

[…] Backtesting — almost wordless (posted in 2010) […]
I see you don’t monetize portfolioprobe.com, don’t waste your traffic, you
can earn extra bucks every month with new monetization method.
This is the best adsense alternative for any type of website (they approve all websites),
for more info simply search in gooogle: murgrabia’s tools