
Variability of volatility estimates from daily returns
November 3, 2011
Investment Performance Guy has a post “Periodicity of risk statistcs (and other measures)” in which it is wondered how valid volatility estimates are from a month of daily returns.
Here is a quick look. Figure 1 shows the variability (and a 95% confidence interval (gold lines) from a bootstrap) of the volatility estimate (black line) for the S&P 500 index in January 2011. Figure 2 is for the first quarter and Figure 3 is for the first half. All of these are with daily data.
Figure 1: Volatility and bootstrap distribution for January 2011 volatility of the S&P 500. 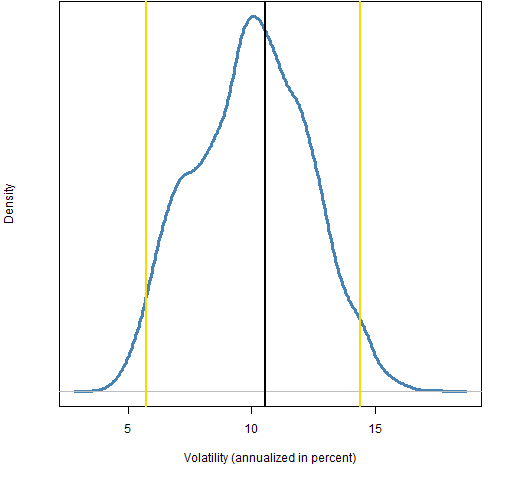
Figure 2: Volatility and bootstrap distribution for Q1 of 2011 volatility of the S&P 500. 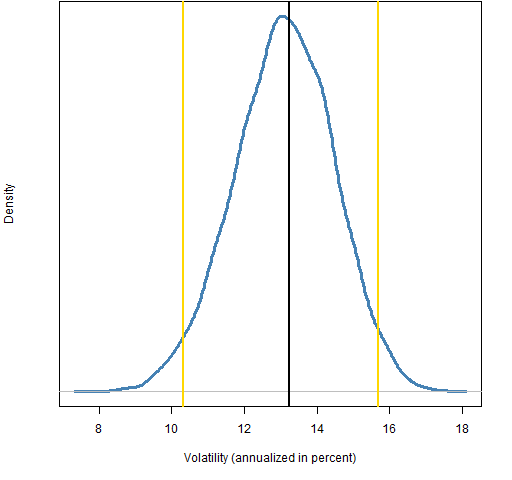
Figure 3: Volatility and bootstrap distribution for H1 of 2011 volatility of the S&P 500. 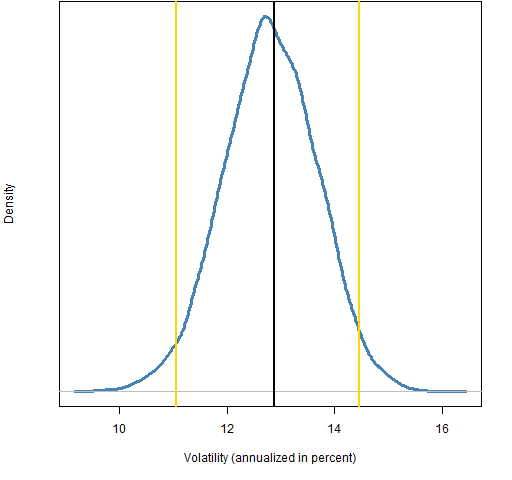
My take
It would be best if the culture changed to include confidence intervals as well as point estimates of volatility.
Appendix R
The bootstrapping is done like:
spxvolQ1.boot
for(i in 1:1e4) spxvolQ1.boot[i] <- sd(spxret11Q1[sample(62,62, replace=TRUE)])
The plots are created like:
plot(density(spxvolM1.boot)*100*sqrt(252))
abline(v=quantile(spxvolM1.boot * 100 * sqrt(252), c(.025, .975)), lwd=2, col=”gold”)
abline(v=sqrt(252) * 100 * sd(spxret11M1), lwd=2, col=”black”)

[…] A post by Investment Performance Guy prompted “Variability of volatility estimates from daily data”. […]