
The scaling of Expected Shortfall
June 16, 2013
Getting Expected Shortfall given the standard deviation or Value at Risk.
Previously
There have been a few posts about Value at Risk and Expected Shortfall.
Properties of the stable distribution were discussed.
Scaling
One way of thinking of Expected Shortfall is that it is just some number times the standard deviation, or some other number times the Value at Risk. Those numbers, of course, depend on the distribution that is being assumed.
t distribution
Figures 1 through 4 show scalings for t distributions with degrees of freedom from 3 to 20.
Figure 1: 95% Expected Shortfall relative to the standard deviation for t-distributions. 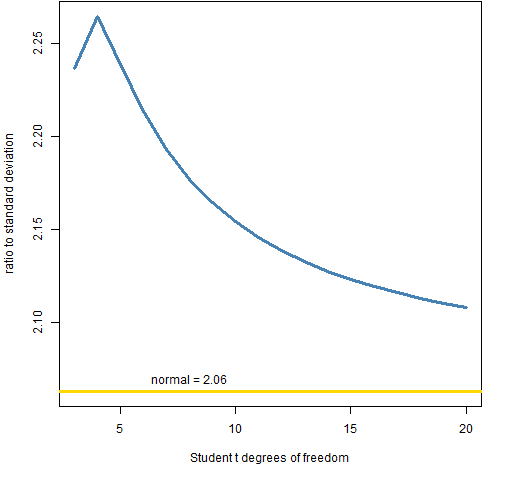 The value for 3 degrees of freedom is almost the same as for 5 degrees of freedom.
Figure 2: 99% Expected Shortfall relative to the standard deviation for t-distributions. 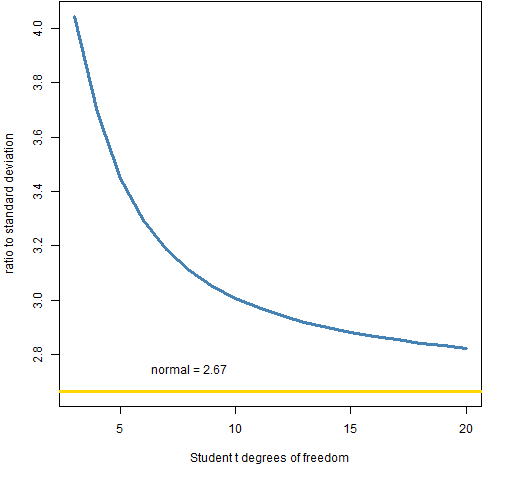
Figure 3: 95% Expected Shortfall relative to Value at Risk for t-distributions. 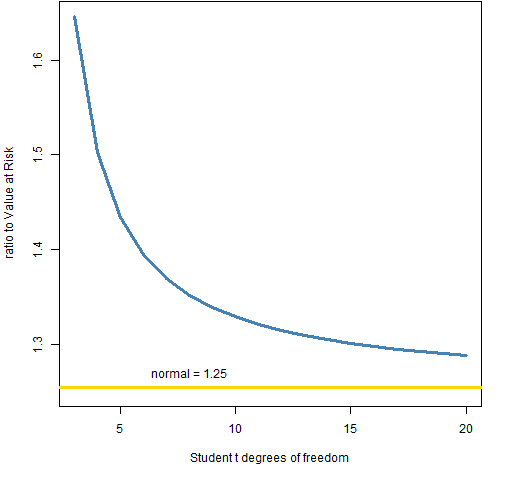
Figure 4: 99% Expected Shortfall relative to Value at Risk for t-distributions. 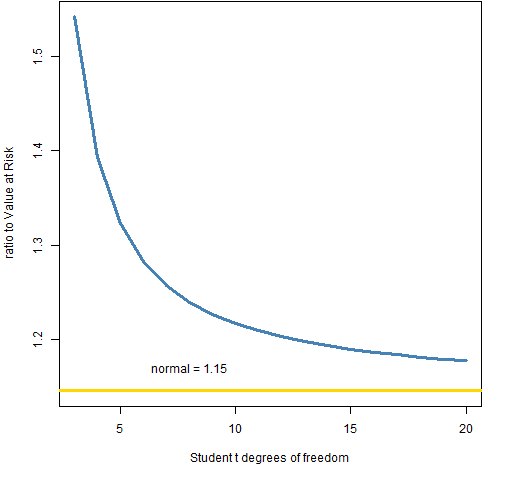
stable distribution
Figures 5 and 6 show ratios to the Value at Risk for values of the stable distribution alpha that are equally spaced between 1.5 and 1.99. The standard deviation is infinite for these distributions.
Figure 5: 95% Expected Shortfall relative to Value at Risk for stable distributions. 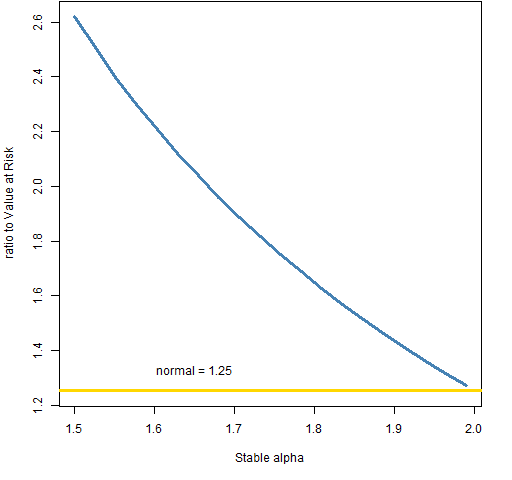
Figure 6: 99% Expected Shortfall relative to Value at Risk for stable distributions. 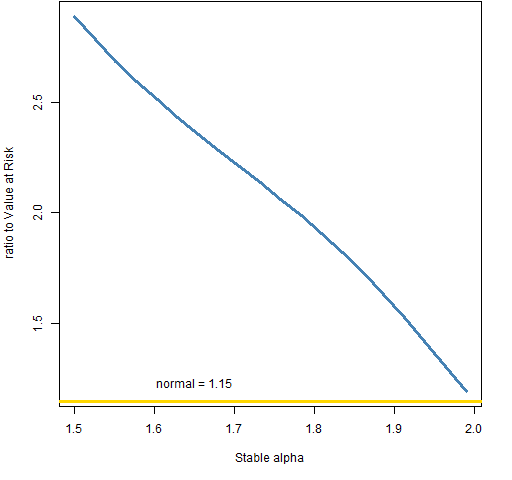
Summary
The range of values in these plots tells us that we are unlikely to know more than one significant digit of the Expected Shortfall even if we knew the Value at Risk exactly (which we don’t — by a long shot).
The true Expected Shortfall is probably not more than three times the Value at Risk.
Epilogue
‘ Cause the dawn and the dying light
Have gathered too much meaning
from “Long Ride” by Taasha Coates and Tristan Goodall
Appendix R
Computations were done in R.
normal distribution
We just need to do an integration and remember to divide by the probability of being in the interval.
sscaleESnorm05 <- -integrate(function(x)
   x * dnorm(x), -Inf, qnorm(.05))$value /
   .05
This is the ratio to the standard deviation (which is 1 in this case).
t distribution
The function to compute the ratios to the standard deviation is:
pp.tscaleES <- function(df, level)
{
  # placed in the public domain 2013
  # by Burns Statistics

  # get scaling of ES relative to
  # standard deviation

  # testing status: very mildly tested

  level <- ifelse(level > .5, 1 - level,
     level)
  ans <- array(NA,
     c(length(df), length(level)),
     list(df, level))
  for(i in seq(along=df)) {
    for(j in seq(along=level)) {
      tdf <- df[i]; tlev <- level[j]
      ans[i,j] <- -integrate(function(x)
        x * dt(x, tdf) * sqrt((tdf - 2)/tdf),
        -Inf, qt(tlev, tdf))$value / tlev
    }
  }
    ans
}
This is used like:
sscaletES <- pp.tscaleES(3:20, c(.05, .01))
stable distribution
The function for the stable distribution is modeled on the one for the t. However, there is no standard deviation so the ratio to the Value at Risk is computed.
pp.stablescaleES <- function(alpha, level)
{
  # placed in the public domain 2013
  # by Burns Statistics

  # get scaling of ES relative to VaR

  # testing status: very mildly tested

  require(stabledist)

  level <- ifelse(level > .5, 1 - level,
     level)
  ans <- array(NA,
     c(length(alpha), length(level)),
     list(alpha, level))
  for(i in seq(along=alpha)) {
    for(j in seq(along=level)) {
      talpha <- alpha[i]; tlev <- level[j]
      tnvar <- qstable(tlev, alpha=talpha,
         beta=0)
      ans[i,j] <- -integrate(function(x)
        x * dstable(x, alpha=talpha, beta=0),
        -Inf, tnvar)$value / tlev / -tnvar
    }
  }
  ans
}
The function was used like:
vscalestabES <- pp.stablescaleES(seq(1.5,
   1.99, length=20), c(.05, .01))

Hi,
it’s a pity that you haven’t introduced and explained the terms that you use. Not everybody is familiar with portfolios, shortfalls, values or risks. This seems to be a language that is very specific to your field. It would cost you only 1-2 paragraphs to actually define (or give examples) of the terms that you use here. As a reward, your post would be accessible to a huge community of R users that do not necessarily come from finance.
To me your post seems neat and potentially interesting, I just have no clue what you are talking about. Real shame as we all know that the best innovation and ideas in a given field usually come from dialogue with other disciplines.
Petr,
Thanks. I think that the post Basics of Value at Risk and Expected Shortfall should address your concerns. If not, then please say what is still missing.