
The R Inferno revised
May 2, 2011
Hell is new and improved.
The R Inferno has been revised. If you don’t know of it, it is a short explanation of a few trouble spots when using the R language. Somehow the short explanation grew to approach book-length.
It can be found at the usual place:
http://www.burns-stat.com/pages/Tutor/R_inferno.pdf
Major improvements
- An index has been added.
- The table of contents is hyperlinked.
Changes
- Assignment functions with namespace extensions didn’t use to work as you would naively expect, now they do. The example of
base::length(w) <- 7
has been removed (from Circle 7.3). - There used to be a way to confuse switch, for example:
switch('E', A=1, B=2, E=5)
but recent versions of R have fixed that problem. - There is now a length method for POSIXlt date-time objects. The lack of such a method previously was a source of confusion for some people. Of course there is still the possibility of confusion but now it is more likely to be people programming with the objects that are the victims rather than mere users of the objects.
- Some additional items and some clarifications of the original items.
If you want the original version for some reason, it is at:
http://www.burns-stat.com/pages/Tutor/R_inferno_090109.pdf
Apologies
Most of the comments on the first version that I’d been saving were lost. So if you made a suggestion for a change or addition and you don’t see it, please try again.
Thanks
Tim Triche, Jr. and Mark Difford are responsible for prodding this revision to completion. Mark did most of the index as well as other changes.
Update
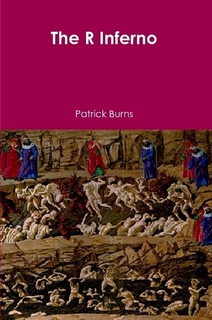
If you have too much money, then you can get rid of some of it by buying a paperback version:

Filling. Loading. Working. Apr – 23, 2013 Moviestarplanet Starcoin Hack (NO DOWNLOAD!) how to get free superstar coins and v.i.p on moviestarplanet it should operate:
) – Length: 10:01.