
Revised market prediction distributions
January 4, 2011
This provides revised plots of the prediction distributions published yesterday. The previous plots of prediction distributions should be ignored — they are not doing as advertised.
We show the prediction distribution of levels of several equity indices (plus oil price) at the end of 2011 assuming nothing happens. That is, we’ve taken out market trends and just left random drift.
North America
Figure 1: Dow Jones Industrial Average (USA) 2011 prediction distribution.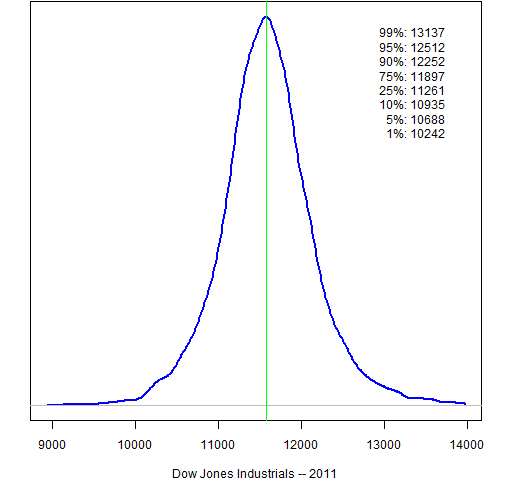
Figure 2: S&P 500 (USA) 2011 prediction distribution.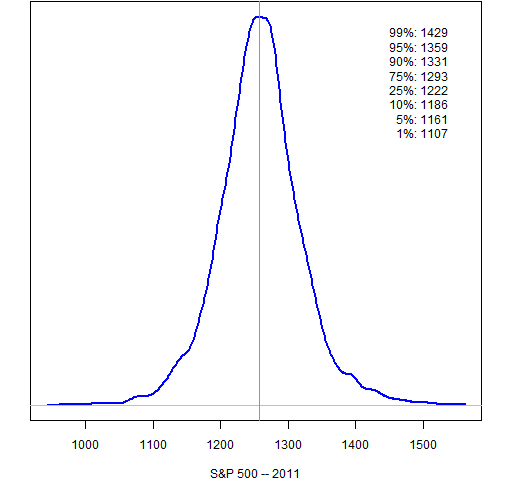
Figure 3: Nasdaq Composite (USA) 2011 prediction distribution.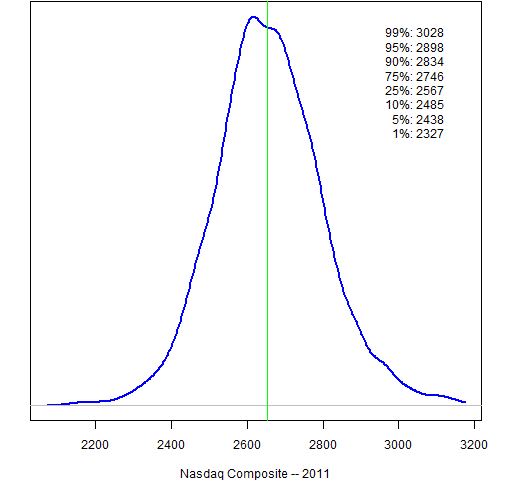
Figure 4: S&P/TSX Composite (Canada) 2011 prediction distribution.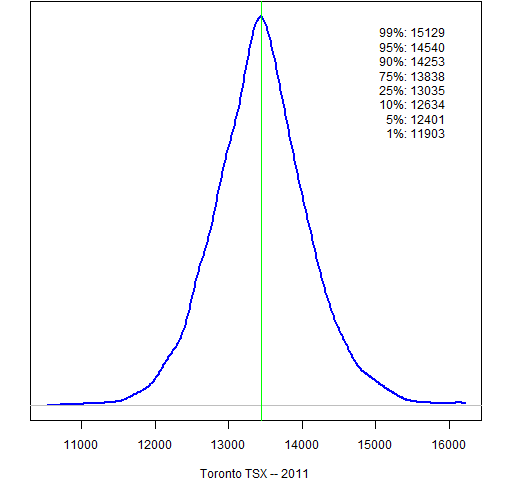
Figure 5: IPC (Mexico) 2011 prediction distribution.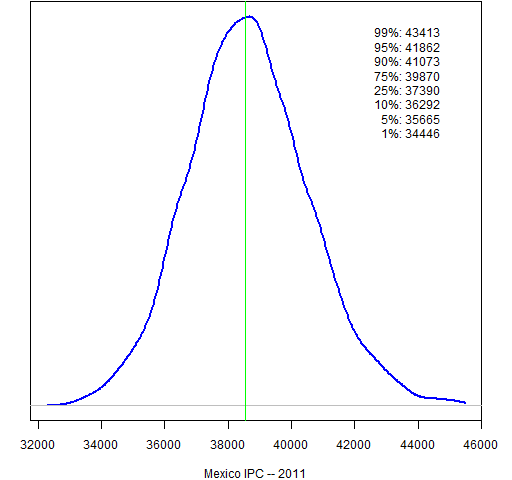
South America
Figure 6: Bovespa (Brazil) 2011 prediction distribution.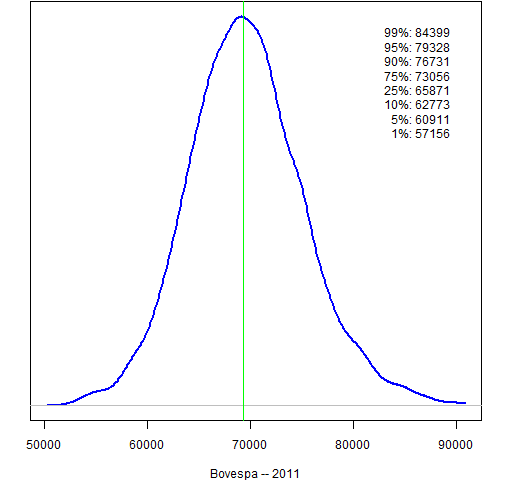
Figure 7: MERVAL (Argentina) 2011 prediction distribution.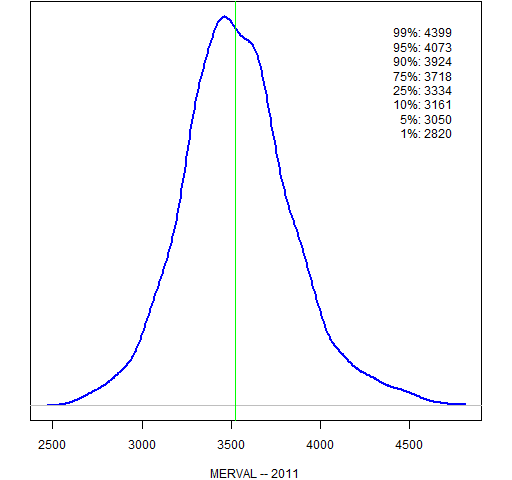
Europe
Figure 8: FTSE 100 (UK) 2011 prediction distribution.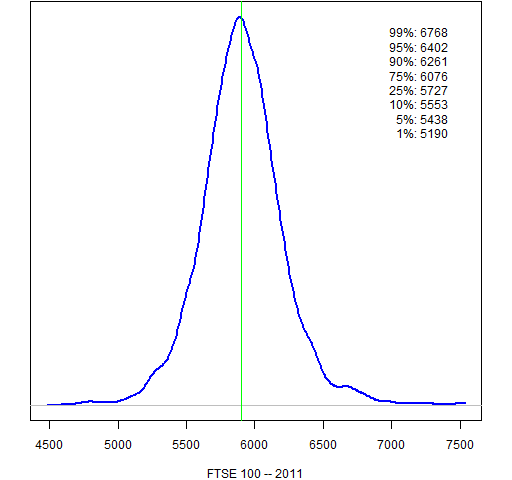
Figure 9: CAC 40 (France) 2011 prediction distribution.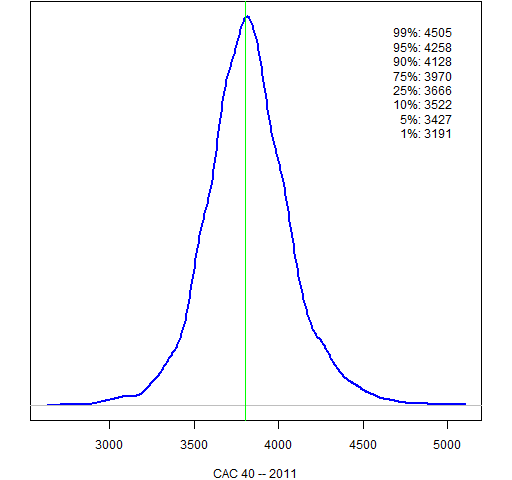
Figure 10: DAX (Germany) 2011 prediction distribution.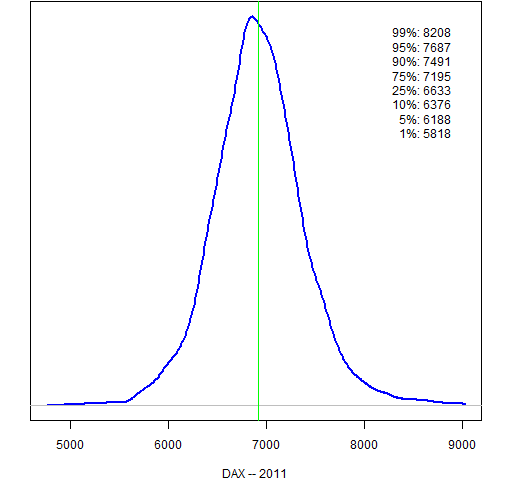
Figure 11: AEX (Netherlands) 2011 prediction distribution.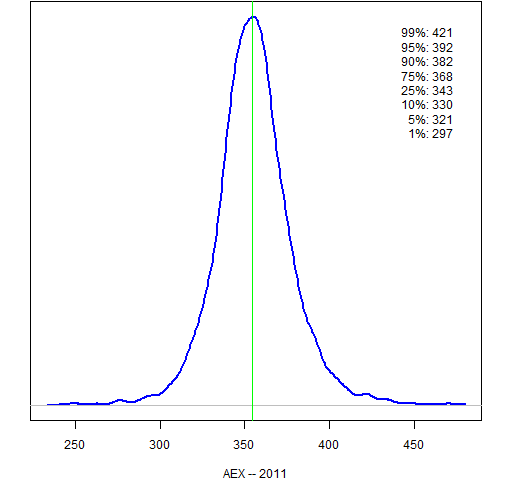
Figure 12: IBEX 35 (Spain) 2011 prediction distribution.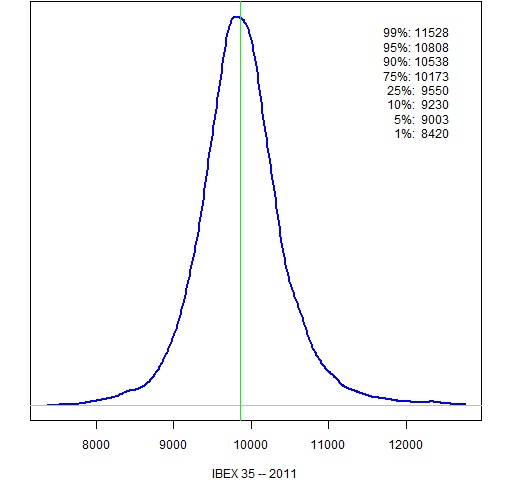
Figure 13: Euro Stoxx 50 (Europe) 2011 prediction distribution.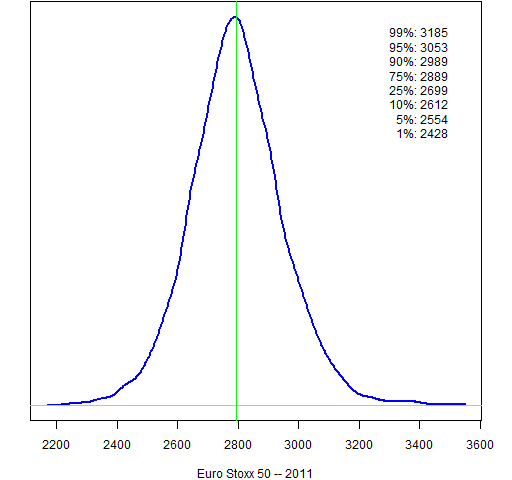
The East
Figure 14: Nikkei 225 (Japan) 2011 prediction distribution.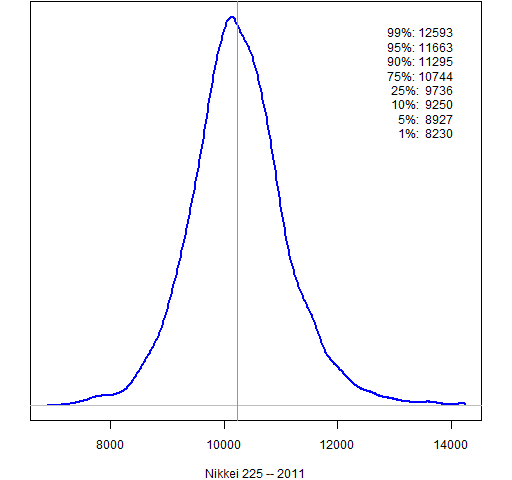
Figure 15: Hang Seng (Hong Kong) 2011 prediction distribution.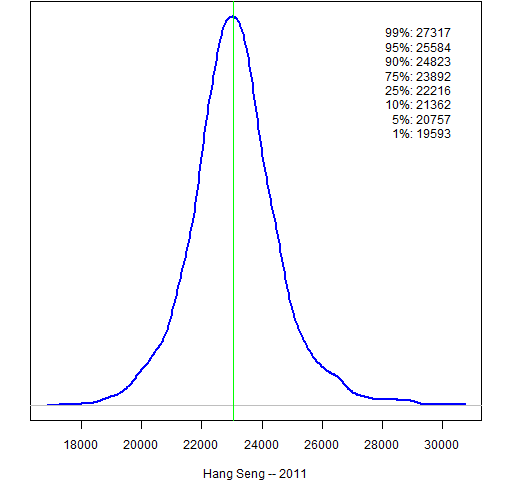
Figure 16: Shanghai Composite (China) 2011 prediction distribution.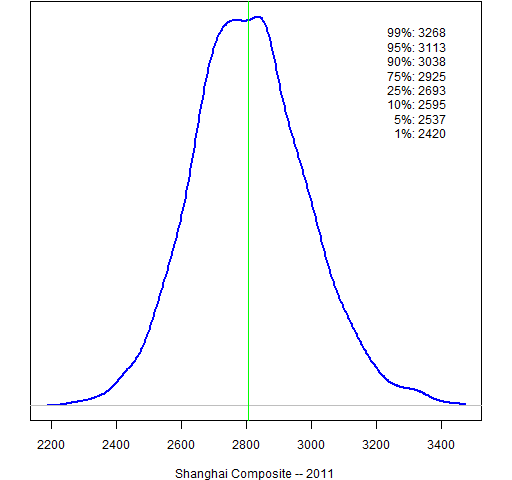
Figure 17: Straits Times (Singapore) 2011 prediction distribution.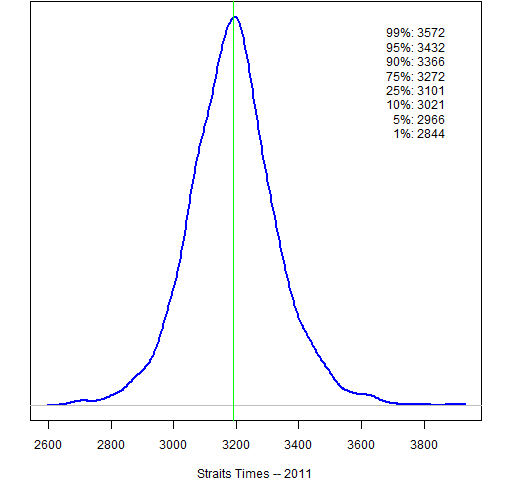
Figure 18: All Ordinaries (Australia) 2011 prediction distribution.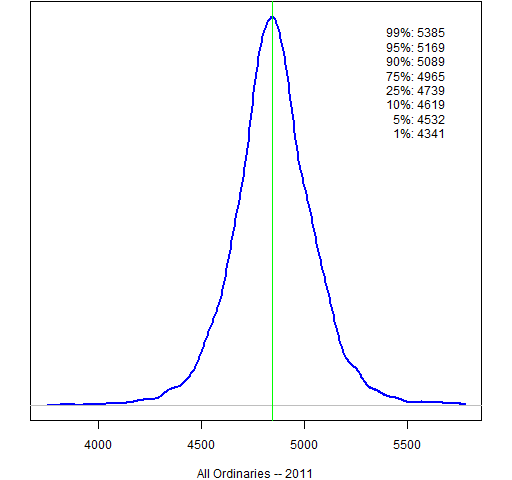
Figure 19: Sensex (India) 2011 prediction distribution.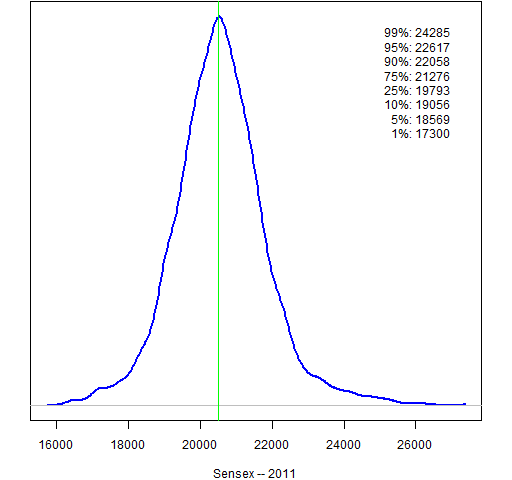
Oil price
Figure 20: Cushing OK contract 1 (US dollar) 2011 prediction distribution.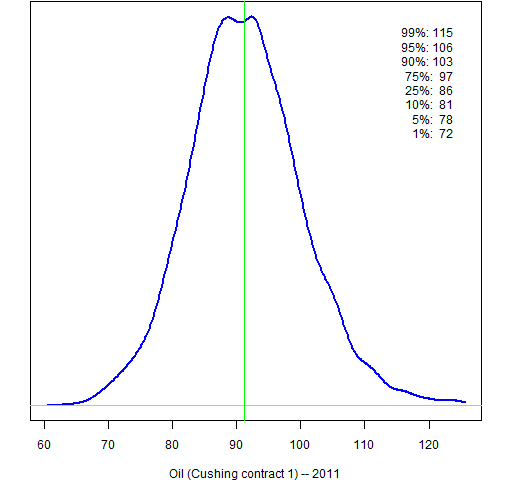
The adjustment
While returns are approximately uncorrelated across time, that is not true of the residuals from the trend. There is significant autocorrelation in the residuals. Taking this phenomenon into account narrows the distributions to be more appetizing and more believable.
The plots are based on a revised simulation that uses blocks of 50 days. That is, for each simulated year 5 continuous blocks of length 50 are randomly selected from the standardized residuals from the garch model. With probability one-half the signs of all of the values in a block are switched — either all or none of the signs in the block are switched.
Why the error happened
Missing this would be an easy thing for a novice to do. However, the problem here was not too little knowledge but too much.
I have done a lot of garch simulations. And I know that using blocks has very little impact. But I’ve (naturally) only simulated garch models of returns. This problem is subtly different. Autopilot mode was too strong.
Epilogue
Figures may be reproduced with attribution.
Stock index data are from Yahoo. Oil price data are from the U. S. Energy Information Administration.
Appendix R
You can get the R functions that are used to create the prediction distributions with the R command:
> source('https://www.portfolioprobe.com/R/blog/prediction_dist_funs.R')
The commands to create the prediction distribution plots are in prediction_dist.Rscript.

Thanks for putting the prediction distribution code in the public domain. You gotta love how easy the garch objects make things from back in the day at Sal. bros. when we had all that messy fortran code. — B
Thanks, Patrick, it’s good to see someone put their money where their mouth is. Two comments:
1. It would be interesting to see the first few moments – mean, sd, skew and kurtosis – on each graph, as a way to start putting a meaning to those numbers;
2. The distributions are for the end of 2011. But do you do any iterated repetitive tests of their accuracy on a shorter time scale?
Rogan,
No, I have no plans to do iterim tests. But results for the full year should appear shortly after the end of the year.
[…] year ago the post “Revised market prediction distributions” presented plots showing the variability of various markets assuming no market-moving […]