
Paying interest and the number e
January 24, 2011
Suppose I borrow a dollar from you and I’ll pay you 100% interest at the end of the year. How much money will you have then?
$1 * (1 + 1) = $2
What happens if instead the interest is calculated as 50% twice in the year?
$1 * (1.5 * 1.5) = $2.25
After 6 months I owe you $1.50 and then at the end of the year I pay 50% interest on that amount.
Or 25% four times per year?
$1 * (1.25 * 1.25 * 1.25 * 1.25) = $2.4414
After 3 months I owe you $1.25. At 6 months I pay you 25% interest on that (which yields $1.5625). At 9 months I pay you 25% interest on that, and so on.
More generally
The formula is:
(1 + 1/n)^n
where n is the number of periods.
We can use R to look at the more general case. Because of R’s vectorization we can do the formula with lots of different n‘s all at once. And we can easily plot the results.
> eseq <- 1:1000
> plot(eseq, (1+1/eseq)^eseq, type="l", col="blue", lwd=3)
Figure 1: Resulting amount for compounding frequency.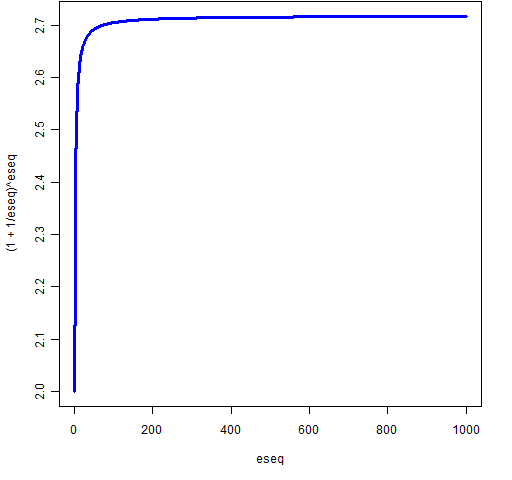 From Figure 1 it becomes believable that as the number of periods increases the amount of money converges to a specific value. That is indeed the case and that number is e.
If we put the x-axis on a logarithmic scale, then we can see better what happens in the plot. We’ll also add a horizontal line at the value e.
> plot(eseq, (1+1/eseq)^eseq, type="l", col="blue", lwd=3, log="x")
> abline(h=exp(1), lwd=3, col="gold")
Figure 2: Resulting amount for compounding frequency with logarithmic x-axis.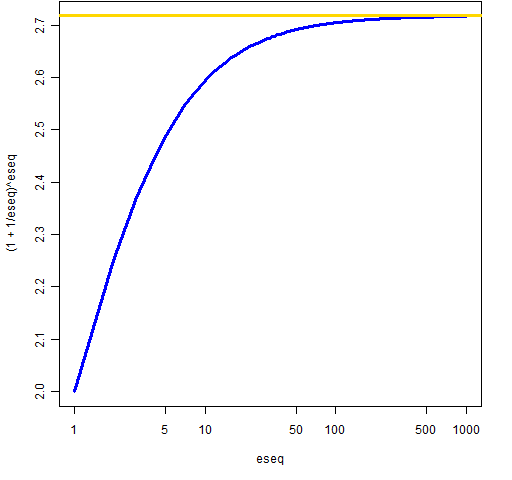 From Figure 2 we see that daily compounding is virtually the same as continuous compounding.
Natural logarithms are those that use e as their base. Note that log returns use natural logarithms.
We’ve just seen why log returns are also called continuously compounded returns.
Epilogue
Money is the seed of money, and the first franc is sometimes more difficult to acquire than the second million.
Jean-Jacques Rousseau

Very nice example. I’ll probably use it later in some of my classes.
Cheers