
Information flows like water
April 16, 2012
Guiding a ship, it takes more than your skill
Spark
David Rowe’s Risk column this month is about data leverage. The idea is that you are leveraging your data if you are using it to answer questions that are too demanding of information.
The piece reminded me of a talk that Dave gave a few years ago, and he was kind enough to remind me of his terminology.
One of his phrases is “statistical entropy”. Very homiletic — I can envision one or more dissertations written on this topic.
But the image that resonates with me is:
Like water, information can never rise higher than its source, and the source is the data you have to work with in the first place.
In academic statistics the game is almost always:
- Given some data, what information can I extract from it?
No possibility of data leveraging here.
In the so-called real world the game is much more likely to be:
- I have to make a decision, what data do I need to inform that decision?
Except that the thought process is often not nearly so clear. In particular it might be more like:
- I have to make a decision, what data do we have lying about that inform that decision?
And “none” is an unacceptable answer.
Information in finance
In finance two very common tasks are:
- predict expected returns of assets
- predict the variance matrix of asset returns
Figure 1 is an illustration of the information situation with predicting returns.
Figure 1: Sketch of the informational requirements of predicting returns. 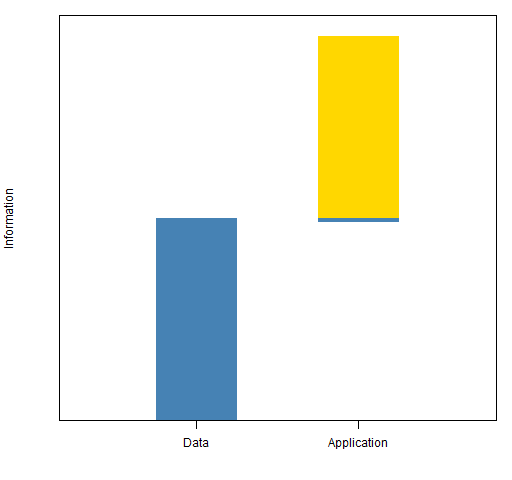 The amount of information available to predict returns is probably exaggerated in Figure 1. In pretty much any other field of study, it would be deemed impossible to do the prediction. However, the ability to predict even a little bit can be worth billions of dollars. Hence a little more effort tends to be exerted.
Figure 2: Sketch of the informational requirements of predicting the return variance matrix. 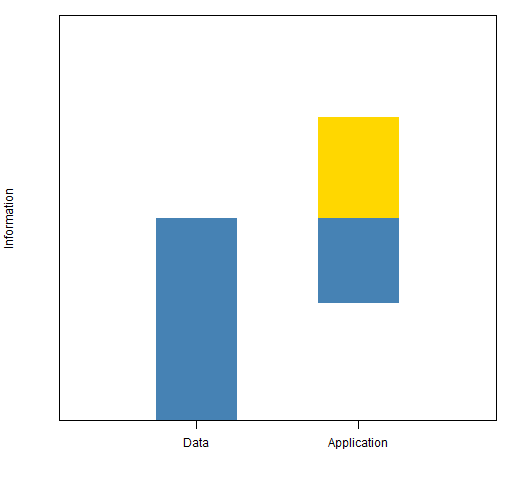
Figure 2 portrays predicting the variance matrix as a much easier task.
“What the hell is a variance matrix?” gives reasons why we should be skeptical that we can get reasonable estimates of the variance.
However, “The quality of variance matrix estimation” shows that we can do okay. We can’t predict the general level of volatility very well. But if we have a portfolio in each hand, then we have a good shot at predicting which one will be more volatile.
Epilogue
You take the wheel one more time like I showed you
We’ve reached the strait once even I could not go through
from “We Learned the Sea” by Dar Williams
Appendix R
The function that created Figure 2 was:
function (filename = "infovarmat.png")
{
        if(length(filename)) {
                png(file=filename, width=512)
                par(mar=c(4, 4, 1, 1) + .1)
        }

        plot(0, 0, type="n",, xlim=c(0,1), ylim=c(0,1),
                yaxs="i", yaxt="n", xaxt="n", xlab="",
                ylab="Information")
        polygon(c(.2, .2, .4, .4), c(0, .5, .5, 0),
                col="steelblue", border=NA)
        polygon(c(.6, .6, .8, .8), c(.75, .5, .5, .75),
                col="gold", border=NA)
        polygon(c(.6, .6, .8, .8), c(.29, .5, .5, .29),
                col="steelblue", border=NA)
        axis(1, at=c(.3, .7),
                labels=c("Data", "Application"))

        if(length(filename)) {
                dev.off()
        }
}

[…] Information flows like water […]
[…] Finance is different. While we have lots of numbers, we don’t necessarily have lots of information. […]