
garch estimation on impossibly long series
September 20, 2012
The variability of garch estimates when the series has 100,000 returns.
Experiment
The post “Variability of garch estimates” showed estimates of 1000 series that were each 2000 observations long. Here we do the same thing except that the series each have 100,000 observations.
That would be four centuries of daily data. It’s not presently feasible to think of a market mechanism being stable for that long.
For 1-minute returns, that is only a year of data. Hence we could actually gather such data and feed it to a garch estimator. The problem here is that there is significant seasonality in volatility throughout the trading day. So to get viable results we would need a more complicated model than a garch(1,1) with t-distributed errors.
Pictures
The figures show the distributions of the estimates of:
- alpha and beta
- the half-life
- the degrees of freedom of the t distribution
- the asymptotic variance
Figure 1: Smoothed scatterplot of the alpha and beta estimates. 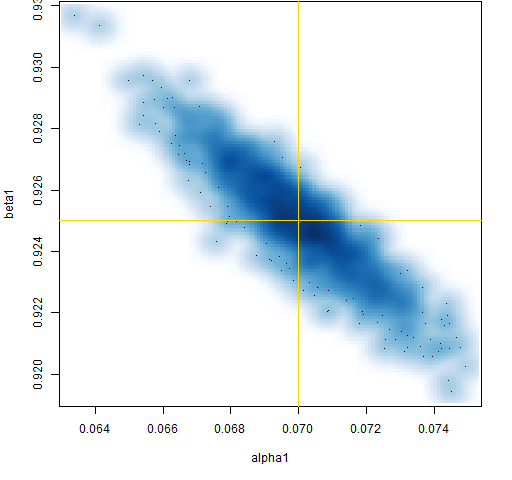
Figure 2: Distribution of the estimated half-life. 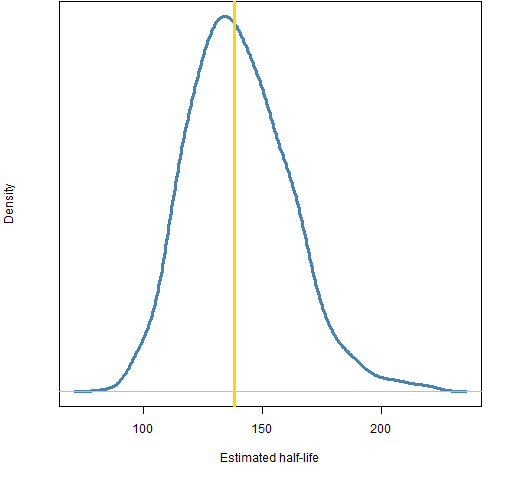
Figure 3: Distribution of estimated degrees of freedom. 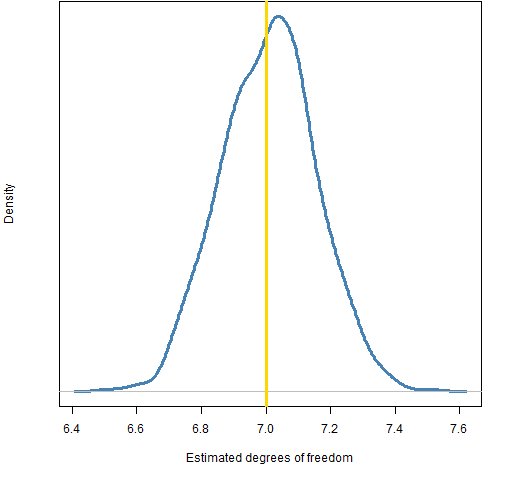
Figure 4: Distribution of estimated asymptotic variance. 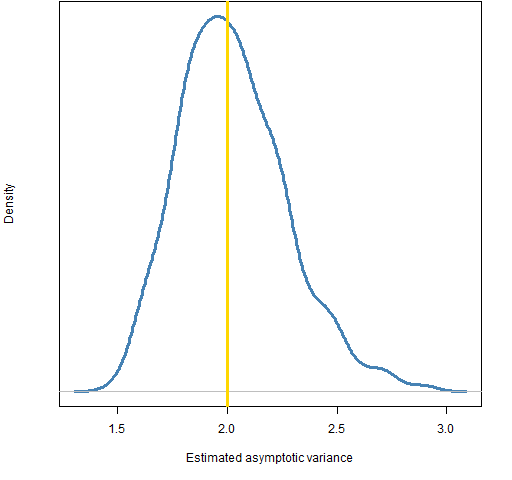
The variability in the estimate of the asymptotic variance is perhaps surprisingly high.
Appendix R
The command (see “Variability of garch estimates” for more details) to do the estimation was:
> system.time(ges.a.100K.07 <- pp.garchEstSim(c(.01, .07, .925),
+        spec=tspec, nobs=1e5, df=7, trials=1000))
    user   system  elapsed
28445.89  2634.36 32473.76
That is 9 hours of elapsed time.

“That would be four centuries of daily data. It’s not presently feasible to think of a market mechanism being stable for that long.”
Very true! Way to think about it that way.
Depending on how one defines “stable”, the market for specie can be arguably stable for millennia.
[…] ← Horses and volatility garch estimation on impossibly long series → […]