
Correlations and postive-definiteness
May 22, 2012
On the way to another destination, I found some curious behavior with average correlations.
The data
Daily log returns from almost all of the constituents of the S&P 500 for years 2006 through 2011.
The behavior
Figure 1 shows the actual mean correlation among stocks for the set of years and the mean correlation with default settings for the Ledoit-Wolf and statistical factor model functions in the BurStFin R package.
Figure 1: Mean correlations within years: sample correlation (gold), statistical factor model (black), default Ledoit-Wolf (blue). 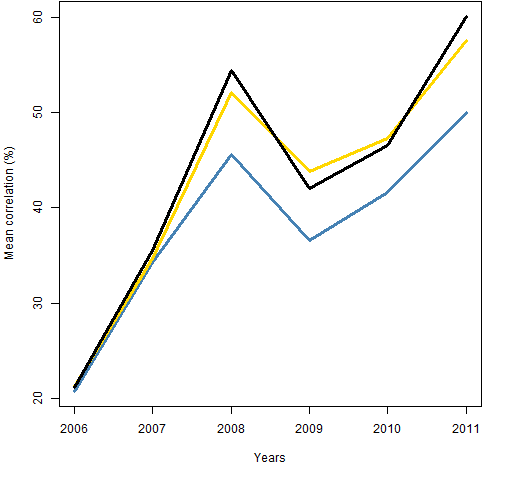
The Ledoit-Wolf estimate has a substantially smaller average correlation in the latter years, when correlation is high.
The values for the variance estimates are not precisely comparable to the sample values because the estimates are given time weights that emphasize the end of the year.
But it seems that it is another argument that is causing the discrepancy. The default behavior of the Ledoit-Wolf estimator is to adjust the eigenvalues so that they are at least 0.001 times the largest eigenvalue. Figure 2 includes the mean correlation when that adjustment is not done — the bias disappears.
Figure 2: Mean correlations within years: sample correlation (gold), default Ledoit-Wolf (blue), unadjusted Ledoit-Wolf (green). 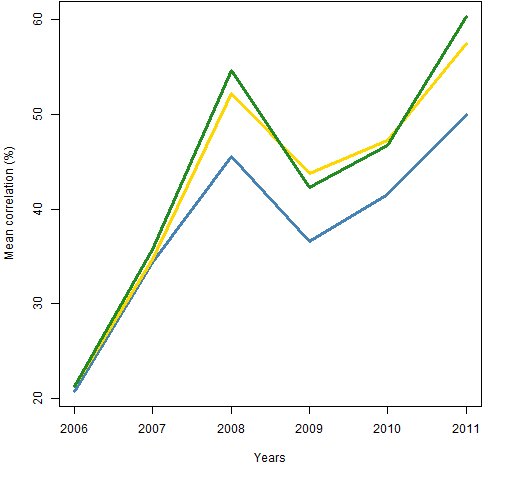 The reason for the adjustment is to make sure that the variance estimate is clearly positive definite.
Eigenvalues
Figure 3 shows the eigenvalues for the two Ledoit-Wolf estimates (with and without the eigenvalue adjustment) for year 2011. Figure 4 shows the eigenvalues for the statistical factor model, the unadjusted Ledoit-Wolf eigenvalues and an indication of the cut-off point for the Ledoit-Wolf adjustment.
Figure 3: Eigenvalues for the 2011 Ledoit-Wolf estimates — log scales. 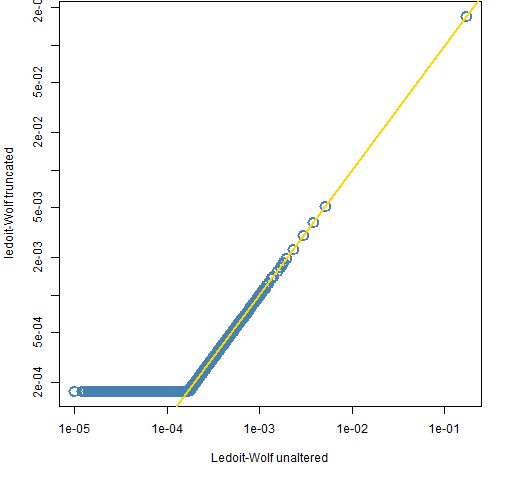
Figure 4: Eigenvalues for the 2011 Ledoit-Wolf and statistical factor model estimates — log scales — with the default Ledoit-Wolf cut-off value (black). 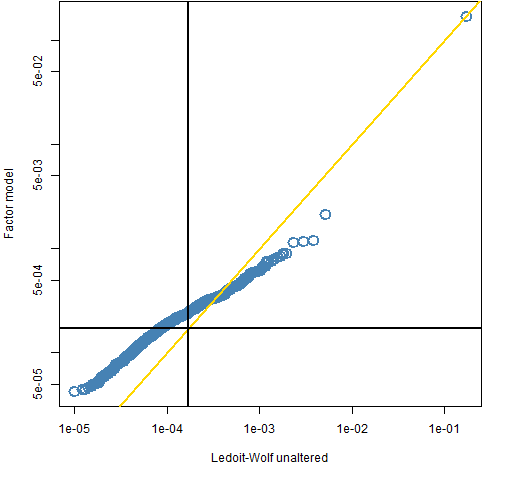
Figures 5 and 6 are like Figures 3 and 4 except they are for 2006.
Figure 5: Eigenvalues for the 2006 Ledoit-Wolf estimates — log scales. 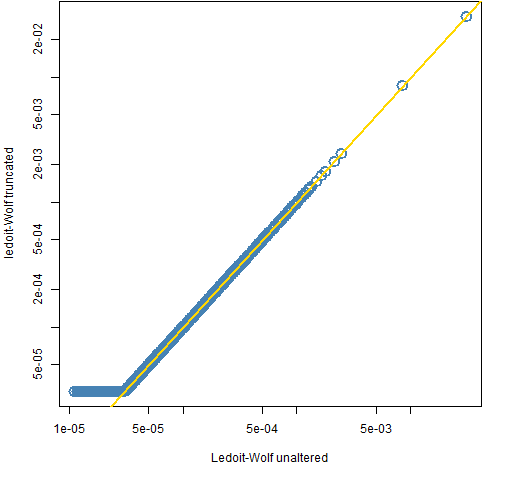
Figure 6: Eigenvalues for the 2006 Ledoit-Wolf and statistical factor model estimates — log scales — with the default Ledoit-Wolf cut-off value (black). 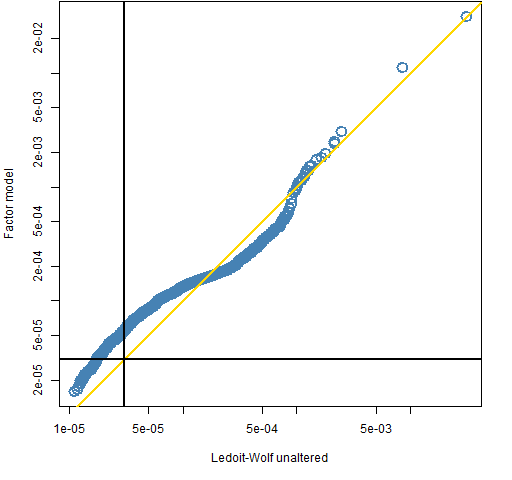
Questions
The value to use as a cut-off for eigenvalues in the Ledoit-Wolf estimate was just a blind guess. This makes it look like it wasn’t such a good guess.
How should we go about investigating what a better guess would be?
How might different uses of the estimate affect what the cut-off should be?
Appendix R
Figure 6 was produced with the following commands. First off, compute the relevant eigenvalues:
eigval.lwzvar06 <- eigen(sp5.lwzvar06)$values
eigval.lwvar06 <- eigen(sp5.lwvar06)$values
eigval.fmvar06 <- eigen(sp5.fmvar06)$values
Now do the plotting:
plot(eigval.lwzvar06, eigval.fmvar06, col="steelblue",
    cex=2, lwd=2, xlab="Ledoit-Wolf unaltered",
    ylab="Factor model", log="xy")
abline(0,1, col="gold", lwd=2)
abline(v=min(eigval.lwvar06), h=min(eigval.lwvar06),
    lwd=2, col="black")

[…] value of the tol argument to var.shrink.eqcor is different in the new version. The blog post “Correlations and positive-definiteness” suggested that the previous default was too […]
[…] value of the tol argument to var.shrink.eqcor is different in the new version. The blog post “Correlations and positive-definiteness” suggested that the previous default was too […]