
The volatility puzzle solved?
September 13, 2010
Finance textbooks say that more volatile assets should have higher returns. The volatility puzzle is that that doesn’t always hold true. You should be getting used to textbooks not always being right.
Harin de Silva gave a talk last week entitled “Low Volatility Portfolios: A Free Lunch?” at a meeting of the CFA Society of the UK. I’ll recreate one set of data that he presented in the talk — some of the details of the explanation might be slightly wrong.
The data run from 1968 to 2005 for the 1000 largest US equities. A five-year window was used to find the volatility of each of the stocks. For each month the volatility was broken into quintiles. Finally the out-of-sample volatilities and returns for each quintile were found, and the window advanced a month.
Figure 1: Out-of-sample volatilities by volatility quintile.
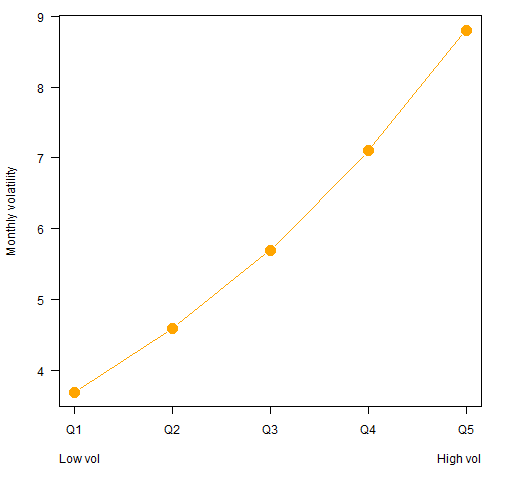
The average out-of-sample volatility looked like Figure 1. This is a pleasing figure — the historically low volatility stocks have realized volatility that is relatively low, and the historically high volatility stocks have relatively high realized volatility. Volatility is predictable.
Figure 2: Out-of-sample returns by volatility quintile.
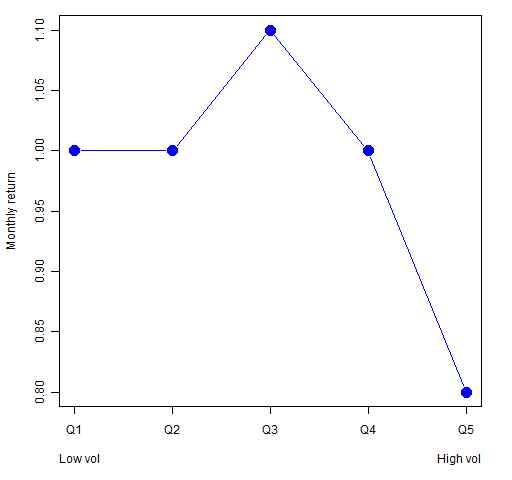
The (rounded) average out-of-sample returns for the quintiles are shown in Figure 2. This is at odds with the textbooks. We should be seeing an upward trend reminiscent of Figure 1. We don’t.
One explanation for the low return for the most volatile quintile is that there is a lottery effect. People are willing to accept a low return (on average) for highly speculative stocks in exchange for the possibility of getting a seriously strong winner. It’s the possibility of getting in at the beginning of the next Microsoft or Google.
But the lottery effect doesn’t explain the basically flat returns across the other quintiles.
Maybe I’m naive, but I think there’s a very simple explanation. We have a group of assets that, for whatever reason, each have their own volatility. In order for the textbooks to be right, the low volatility assets need to be bid up so their expected returns are reduced. Likewise, high volatility assets need to be shunned enough that their expected returns rise.
In other words, people have to be paying attention to the issue. Hardly anyone is. Only a few people are buying low volatility portfolios. Everyone is just looking at market capitalization. Is this not a reasonable explanation?
Harin discussed another puzzle in his talk. He says that marketing low volatility portfolios is hard because they have a high tracking error to the (market cap) index. Here’s a puzzle I can’t solve.
If a portion of your portfolio is in (cheap) index funds and you are offered another cheap fund (a low volatility fund), do you want the correlation of those two to be low or high? The textbooks say you want low correlation. I agree (I’m not totally against textbooks).
So why would people complain about high tracking errors, which are synonymous with low correlation?
Harin and his colleagues have more on this at http://www.aninvestor.com/lowvol/.

[…] at a few aspects of minimum variance portfolios. We’ve been in this neighborhood before with The volatility puzzle solved? This post contains some comments on Bernd’s […]
[…] Reality says that the most volatile stocks have the lowest expected returns. See, for example, The volatility puzzle solved? — specifically Figure […]