
Horses and volatility
September 14, 2012
Two items struck me as being connected. Maybe they are.
The items:
- Payoff of betting on horses versus the odds
- The Missing Risk Premium by Eric Falkenstein
As you can see there is a unicorn on the cover, but that is not the horse connection I had in mind.
Horses
The post at Thinking in Systems called “Lottery stocks, horse races and the human love of the long shot” has a couple of interesting plots. The plots are taken from the paper “Explaining the Favorite–Long Shot Bias: Is it Risk-Love or Misperceptions?” (which is linked to in the post) by Erik Snowberg and Justin Wolfers. One of those plots is presented as Figure 1 here.
Figure 1: Odds and expected return in horse betting. 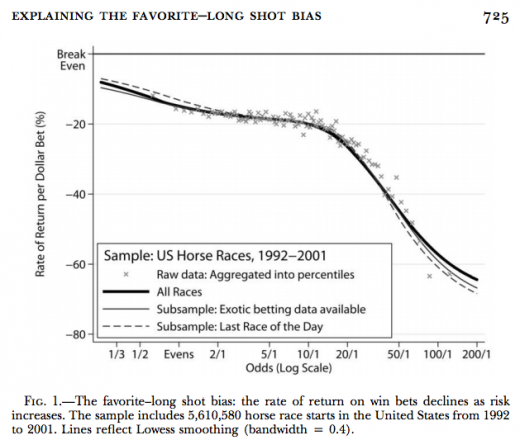 So the longer the odds, the more you can expect to lose.
Eric’s book
Speculation
I haven’t yet read the book, but there are likely to be pictures in it on the order of Figure 2. I’m guessing the book is more likely to have volatility on the x-axis than beta. But the picture tends to look similar even though beta is not volatility.
Figure 2: More risk in equities often does not engender more return. 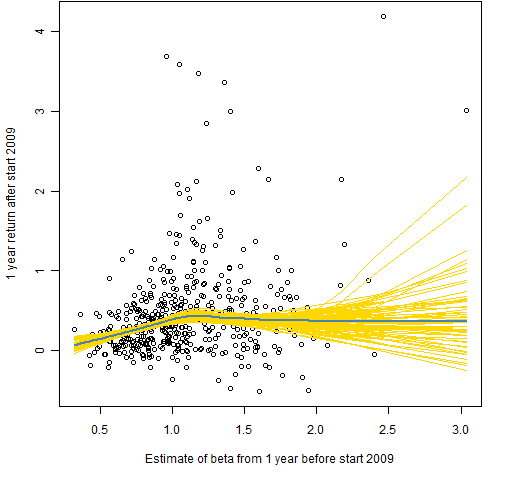 This figure is taken from the post “Beta and expected returns”.
Perhaps Figures 1 and 2 fit side by side with Figure 2 on the left.
Something real
Aaron Brown has a review of Eric’s book: “‘The Missing Risk Premium’: A Book That Will Change the Way You Think About Trading” that actually says something.
Biases
There are reasons to think that there’s not much of a connection between horse-betting and the high volatility anomaly:
- the people who move equity markets are not the same people who move horse-betting markets
- (for most) gambling is entertainment and not meant for profit
The entertainment of gambling is the possibility of winning big — from that perspective it would be surprising if long shots didn’t have lower expectation.

[…] On the relationship between betting on horses and low volatility anomaly. (Portfolio Probe) […]